

Since our last call in February 20th, Microsoft is up +30%, recovering from a though fall, mainly after earnings on July 29th.
https://corevaluequest.com/2026/02/20/we-need-to-talk-about-microsoft/

Today we will review the latest earnings in depth!
Full fiscal year 2026 (ended June 30th)
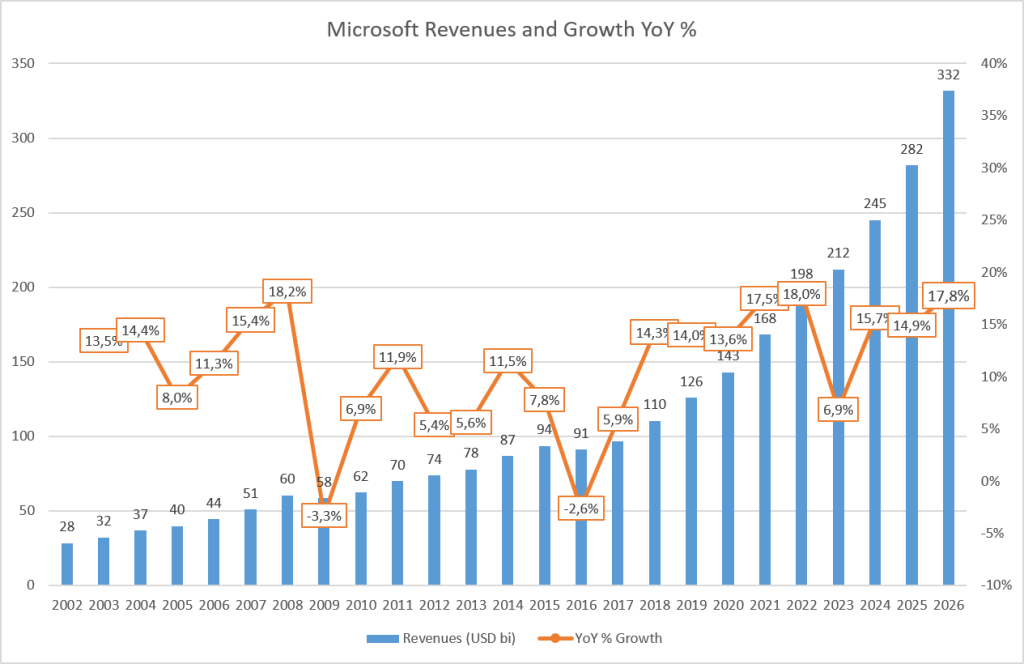
- In FY 26, Microsoft delivered revenue of $332B, +18% YoY (growth accelerated vs prior years!)
- Microsoft Cloud passed $214B, up +27% — nearly 90% of cloud revenue from customers outside frontier model companies (very important signal!)

- Azure grew +40%, reaching $100B in FY 2026.
- The Azure beat is a supply story, not a demand story. Every driver Amy Hood named — fleet efficiency, faster dock-to-live, earlier capacity delivery — is about converting constrained supply, not new demand. That’s a good problem: it means the Azure growth rate is currently a function of Microsoft’s execution against a fixed ceiling.

Backlog
- The bookings inversion: Commercial bookings +18% ex-OpenAI; and +10% including OpenAI Azure commitments (i.e. the OpenAI comp is now a drag on the growth rate, not a boost)
- Commercial RPO +84% to $678B — with the explicit disclosure that ex-OpenAI it’s +25% and that all sequential growth came from non-frontier-model customers (an excellent signal of broadening demand!).
- All sequential RPO growth came from customers outside frontier model companies — a deliberate, repeated de-concentration message
- Weighted average duration 2.3 years; ~30% recognized in the next 12 months (+37% y/y); the portion beyond 12 months +112%

- Microsoft Revenues by Segment: Productivity and Business Process (the software component) reached USD 140 bi, while Intelligent Cloud (the cloud infrastructure component) is quickly catching up, gaining share in Revenue due to its superb growth!

- Intelligent Cloud grew +29,7%, an impressive acceleration from FY 2025.
- Productivity and Business Process +15,9%, albeit smaller, we are talking mid-high teens growth to USD 140 bi, with incredible profitability/return profile.
- Personal Computing was practically flat YoY, reaching now 16% of total revenues (from 19% in FY 25).

- The fact is that Intelligent Cloud is quickly gaining share in Microsoft Revenues, being almost the size of the PBP Business!

Worth noting that Microsoft changed Revenue Classification in FY 2025 and FY 2026, which affect growth comparison longer term. Also, for FY 2027 there will be a new segmentation that we will approach in a next post!
- Operating income grew +21% to >$155B — opex growth outpaced by OI growth, i.e. operating leverage expanded, margins reached 46,8%.

- Net Income of USD 133,7 bi, a growth of 31,3%.
- We should recognize that this number include USD 4,9 bi impact from OpenAI and USD 3,2 bi impact from Anthropic. Nevertheless, excluding this USD 8,1 bi impact we get USD 125,6 bi which is still 23% growth YoY!

Microsoft Cash Flow: An important perspective
We see a lot of content arguing for this is “the end of Microsoft free cash flow machine”. We respectfully disagree and here is were we think the value lies!
- Microsoft Free Cash Flow indeed has fallen from USD 74 bi in FY 25 to USD 47 bi in FY 26, and should only be “positive” in FY 27. Great.
- Have you also noticed that the Operating Cash Flow reached an all time high of USD 182 bi, an incredible +34% growth on Cash Received

- To help us analyse the cash trend, we use a proprietary metric we call Free Cash Flow * (star).
- Is pretty simple actually, we use the current depreciation as a measure of Maintenance Capex
- By this measure, Microsoft generated USD 144 billion before Expansion Capex, +34% YoY and an impressive 43% margin.

- Last but not least: total cash returned to shareholders >$43B (declared) and $48 bi paid.

We will delve deeper in Marginal Return Analysis, but is clear from the Statements that Microsoft is in fact already generating an enormous amount of cash that should be even greater and more directly visible after the demand curve acommodate.
The AI infrastructure / capex / margin story
This is where the call carried the most signal.
Physical build
- 31 new data centers across 5 continents this quarter; 88 for the year
- Another gigawatt of capacity added this quarter; on track to roughly double total capacity in two years
- Dock-to-live time for new GPUs cut by nearly 50% in the largest regions over the fiscal year — this is the operational lever Amy converted into revenue in Q4
Silicon and efficiency
- Maia 200: 30% better performance per dollar than the latest generation in the fleet, now serving both OpenAI and MAI models; MAI models get 40% better performance per watt on Maia.
- Will be among the first to deploy AMD Helios and NVIDIA Vera Rubin rack-scale systems — so first-party silicon is additive, not a replacement.
- Cobalt CPUs: “when it comes to running agents, CPUs are just as important as GPUs” — Cobalt 200 racks in 25+ data centers by month-end; customers include Adobe, Arm, Elastic, OpenAI, Sprinklr, TomTom.
- Copilot workload throughput up 4x since the start of the year.
Software-side unit economics (the cost-to-outcome argument)
- MAI-Code-1-Flash on GitHub Copilot: higher code acceptance rates, 10% lower median token usage
- In Excel, MAI-Code-1-Flash delivers “comparable quality to GPT-5.6” at significantly lower cost
- MAI-Cyber-1-Flash beats a much larger Mythos model at half the cost with their multiagent harness
- 89% GPU cost reduction in Dynamics 365 (MAI-Voice-2-Flash); up to 84% reduced GPU costs in PowerPoint (MAI-Image-2.5)
- Architectural claim: harness, context, memory and action space are kept separate from any one model family, making every model substitutable — framed as both a cost lever and a business-continuity lever
The accounting change — read this one carefully
Effective at the start of FY27, Microsoft extends the estimated useful life of data centers and office buildings from 15 to 25 years. Management’s framing:
- “This change affects only the timing of future depreciation and is expected to have a minimal benefit to FY27 operating income.”
- “The greater impact is on capital expenditures, as more of our future data center leases will shift from finance leases to operating leases. Finance leases are included in capital expenditures while operating leases are not.”
- “Outside of this useful life impact, our calendar year 2026 CapEx investment expectations remain unchanged. However, the shift from finance to operating leases adjusts our expectation to approximately $175 billion.”
So the CY26 capex number moves down to ~$175B without a single dollar of reduced commitment. The obligation migrates off the capex line and into operating lease expense. Q1 FY27 capex is guided >$50B “including the lease reclassification impact.”
FY 4Q26 (Calendar 2Q26)
| Metric | Q4 FY26 | Comment |
| Revenue | $90.0B | +18% (+17% cc) |
| Gross margin $ | +15% | below revenue growth |
| Company GM% | 67% | down y/y — Azure mix + AI infra |
| Operating income | +18% | margin 45%, up slightly |
| EPS | $4.74 | +23% adjusted for the OpenAI investment impact |
| Opex | +10% | R&D compute capacity, talent, data |
| Headcount | −2% y/y | |
| CFO | $55.4B, +30% | strong cloud billings/collections |
| FCF | $19.6B | compressed by capex |

- In FY 4Q26 Microsoft delivered USD 90 bi in Revenues, up 18% YoY. 0.6pp above our estimates.
- Gross Profit went up by 15% a 1,4pp decline YoY and also below our expectations. Q1 guides COGS +23–24% against revenue +16–17% — roughly another 1.5–2 points of gross margin compression, held at the operating line by opex discipline.
- Flat operating margins are being bought with headcount and opex restraint, not with gross profitability.
- Net Income came $35,8 bi (EPS 4,81 GAAP) a +31% and +32% growth YoY (+7% ahead of our estimates).
- Adjusting for impact from OpenAI. EPS was $4.74, +23%
- And with we make other adjustments including a $3.2B Anthropic mark and expenses related to the Voluntary Retirement Program we would adjust another +$0.27 discrete benefit, getting to a EPS of USD 4,47 for the quarter, still a 22% EPS growth!

- Microsoft delivered another beat, +3,2% above guidance (against an average of 2,5% since 2023!)

- Operating Income reached USD 40,6 bi, up 18,4% YoY.

- Microsoft Operating Income came 1,1% above guidance (against a 1,3% average since 2023).

Cash Flow

- Cash Flow from Operations Increased 30% YoY. to USD 55,4 bi! Thats a 62% margin for the FY 4Q26! CFO came 4,8% above our expectations mainly due to a worse working capital release vs expected!
- Cash Capex came USD 35,8 bi, a 109% growth YoY and above our USD 28 bi; Reached 40% of Revenues! (But as we argue before, the growth should also keep showing!)
- If we consider lease investments, Microsoft Capex reached USD 41 bi in FY 4Q26.
- Free Cash Flow here is FCO minus Cash Capex, reached USD 19,6 bi, lower than ours as FCO came little below and Capex came high above our numbers.

Segment detail


Productivity & Business Processes — $37.8B, +14%
- M365 Commercial cloud +16% adjusted (normalizing 2 pts of prior-year in-period rev rec) / +14% reported
- Copilot paid seats >30M; with net adds more than doubling sequentially, and the >50,000-seat cohort up 7x y/y
- Paid M365 Commercial seats +6%, but expansion came “primarily in small and medium business and frontline worker offerings” — i.e. the seat growth is at the low-ARPU end; ARPU growth came from Copilot, E5 and early E7
- M365 Commercial products +19%, ahead of expectations, from large long-duration contracts and Windows Commercial on-prem in-period recognition (a timing benefit that reverses — guidance immediately calls for mid-single-digit declines for the full year.)
- M365 consumer cloud +24% (+22% cc), subs +7%; LinkedIn +12% (+10% cc), driven by Marketing Solutions
- Seat mix is diluting. Paid M365 seats grew 6% “primarily in small and medium business and frontline worker offerings,” and the Q1 guide says sequential growth is “mitigated a bit by the lower ARPU new seat adds.” Premium SKUs are carrying ARPU; volume is coming from the cheap end.
- Dynamics 365 +13% (+12% cc); ERP bookings healthy, CRM moderating with longer sales cycles — the one soft spot management named unprompted
- GM$ +14%, GM% down slightly on Copilot usage; opex +11%; OI +15%, margin 58%
Intelligent Cloud — $39.3B, +32% (+31% cc)
- Azure +43% against a prior year that was itself accelerating. “Customer demand continues to exceed available capacity.”
- The beat was attributed to: (a) efficiency gains across the CPU and GPU fleet, (b) process improvements enabling earlier delivery of new capacity, which “was quickly monetized,” and (c) stronger-than-expected GitHub Copilot consumption after the June shift to usage-based pricing
- On-prem server flat (−1% cc), ahead of expectations on renewal mix
- GM$ +24%, GM% down on Azure mix and scaling AI infra ahead of demand; GitHub Copilot usage was a margin drag that improved through the quarter once usage-based pricing took effect
- OI +31%, margin 41%, flat y/y

More Personal Computing — $12.9B, −4% (−5% cc)
- Windows OEM & Devices −7%, Windows OEM −5% on weaker PC demand and the Windows 10 end-of-support comp — but “ahead of expectations as OEM and channel partners continue to build inventory given increasing component prices”
- Search & news ad revenue ex-TAC +10% (+9% cc) on higher revenue-per-search and volume, held back by third-party partnerships
- Xbox −10% (−11% cc); content & services −10%. GM% actually rose on lower Activision amortization; opex +8% including Xbox impairment; OI −14%, margin 21%
- Xbox is being reset in public. Impairment charges, severance, −10% revenue, and a promise to “return the business to growth in fiscal 2027” — with Q1 guided down again.
- MPC “ahead of expectations” is a pull-forward. Channel partners built inventory ahead of component price increases — and the very next paragraph guides Windows OEM & Devices down low 20s in Q1 and down high teens for the year. Q4’s upside is Q1’s headwind.


Guidance
FY27 (full year)
- Another year of double-digit revenue and operating income growth
- Opex growth mid-to-high single digits; capex to grow year over year
- Full-year operating margins down less than 1 point
- Free cash flow positive (note the phrasing — positive, not growing)
- Effective tax rate ~20%; FX a <1 pt headwind to revenue
- Headwind reminders: M365 Commercial products and Server products revenue both down mid-single digits for the year (lapping transactional purchasing);
- Windows OEM & Devices down high teens
Q1 FY27
| Line | Guide |
| Total revenue | $89.85–90.95B, +16–17% |
| PBP | $36.7–37.0B, +11–12% |
| M365 Commercial cloud | ~16% cc adjusted / 15% reported |
| Intelligent Cloud | $40.95–41.25B, +33–34% |
| Azure | ~45% cc |
| MPC | $12.2–12.7B |
| Windows OEM & Devices | down low 20s |
| Search ex-TAC | mid-single digits |
| Xbox content & services | down mid-single digits; hardware down |
| COGS | $29.6–29.8B, +23–24% |
| Opex | $16.8–16.9B, +7–8% |
| Operating margin | roughly flat y/y |
| OI&E (ex-OpenAI) | ~−$100M (interest expense incl. DC finance leases exceeds interest income) |
| Capex | >$50B |
Amy added that Microsoft Cloud gross margin % should be relatively stable q/q, that H1 Azure growth should still accelerate, and that M365 Commercial cloud growth should accelerate through the fiscal year as usage-based billing (added in July) layers on top of per-seat.
Other Highlights
- Open vs Closed Models: Satya’s answer was the philosophical centerpiece of the call. The goal is for the firm to control its own destiny across “human capital and token capital.” Models are “an input, not some extraction of the knowledge of the enterprise” — “this is not going to be about come in and take all my knowledge and benefit yourself, whereas I am not getting anything out of it.”
- Architecturally: keep the harness separate from the model, keep memory and context external, and any model becomes swappable. Use frontier models where they earn it, low-cost models where they suffice, and train your own when you don’t want an external model at all — “you have all the output, you have all the traces, you have all the context.” He invoked the Hugging Face incident as evidence you cannot depend on a single model: “you can’t be subject to the refusal of one model.” Closing line: “The frontier is about every firm having a frontier.“
- Amy’s add was the commercially relevant half: whatever model wins, it runs on Azure, and “think about that infrastructure as being pretty fungible.”
- Amy: Azure acceleration was mostly execution. Constraints remain and demand still exceeds supply — “you can even see it in some of the pricing that’s occurring in the spot market for assets.” The delta to mid-40s was efficiency across the CPU and GPU fleets plus lead-time process improvements made “over the past 90 days.” The key mechanic: “because of the supply-demand imbalance, when we can make efficiency gains, they are quickly monetized in quarter.”
- Amy’s defense on question about overcapacity/overbuild, in order: (1) capex has pivoted toward short-lived assets — CPUs and GPUs with relatively short lead times — so “if the demand environment changes, you just slow down what is, in fact, the largest component and the driver of COGS”; (2) land and data center builds are “quite flexible,” a smaller percentage of the cost structure, and the timing can be staggered; (3) the book of business is diverse by geo, segment and industry, and the RPO added this quarter reflects that breadth; (4) late-binding the expensive components; (5) a large first-party app business that also consumes the capacity being built.
- On component pricing Amy was noticeably less specific: it’s “impacting everybody equivalently,” the response is efficiency work, the cloud still beats buying servers on-prem into a rising-price market, and newer contracts are being priced to reflect it — “we’re able to have the pricing reflect it, but keep value.”
- Satya added the cycle framing: “all of us are reading this 1873 as the book to be read” (he doesn’t elaborate further in the transcript), then four requirements — get the product shape right, the portfolio right, the customer mix right (geo, segment, workload, factored into how capacity is built), and “run an efficient railroad,” where efficiency “is not something that will just show up at the end. You have to sort of monotonically work at it.” Conclusion: “there will be ups and downs of what is the cycle here. But the secular shift is clear.”
- Satya on Monetization Strategy: it starts with product shape — chat → Cowork → Autopilots → Code, converging into one “super app” spanning consumer and commercial. The deployment evidence: time from license purchase to usage has gone from months to days, and usage intensity is “at the same level of what is an everyday communication tool like Outlook or Teams.” Second, enterprise wiring: E7 ties Copilot into Agent 365 governance so ITOps, SecOps and FinOps are all wired in, and CRM/ERP become “skills and plug-ins that go into Cowork.” Third, the business model: per-seat plus usage. “Historically Office compared to what Copilot is, is much more narrow… the TAM is much more expansive.”
- Amy’s version was more concrete: this year’s ARPU growth came from E5 + the Copilot license; more will come from E7, whose value sits largely in Agent 365 — “everyone is going to need both observability of token spend and the manageability of token spend.” E7 was only in market for part of the quarter.
- Satya then gave an unusually specific anecdote: he took a sell-side ROIC PDF into Copilot and asked for a Power BI-style dashboard; it built a semantic model into Fabric/OneLake, pulled in external sources current with MAG7 SEC filings, put the repo in GitHub, surfaced the artifact as a Copilot site, and registered the whole thing with Agent 365 — knowledge worker, data engineer and professional developer each meeting the same artifact in their own tool.
What Worth Watching:
- Q1 guides COGS +23–24% against revenue +16–17% — roughly another 1.5–2 points of gross margin compression, held at the operating line by opex discipline.
- Usage-based billing now live across three surfaces: GitHub Copilot (June), Cowork (this month), Dynamics 365 customer service (credit consumption +4x q/q) — and GitHub Copilot revenue accelerating 60%+ q/q after the change
- Headcount −2% y/y alongside 18% revenue growth
- E7 attach, now that it has a full quarter in market, and whether ARPU can outrun the frontline/SMB seat-mix dilution.
- Whether Azure actually hits ~45% cc, and whether the driver shifts from efficiency-unlock back to new capacity coming online (gigawatt cadence, dock-to-live).
- FY27 opex growth guided to mid-to-high single digits against double-digit revenue growth — the operating-leverage promise made explicit
- The useful-life change, 15 → 25 years, and the resulting finance-to-operating-lease shift that restates CY26 capex to ~$175B, but the capex number is now optically ~lower for a purely presentational reason. Comparing the ~$175B CY26 figure to prior expectations without adjusting for the lease reclass would be an error, and Amy said as much — “outside of this useful life impact, our CY26 capex expectations remain unchanged.” Operating lease payments already showed up as a drag inside the +30% CFO line this quarter.
- FCF is the pressure point. $19.6B FCF on $55.4B of operating cash flow, and FY27 is guided only to remain “free cash flow positive.” With capex >$50B in Q1 alone.
- Copilot dollars are still not disclosed. Seats, satisfaction scores, conversations per user, engagement parity with Outlook — all offered. Copilot ARPU, Copilot revenue and the AI share of Azure are not. Same for the agent metrics: “~40M agents registered” and “650,000 MCP actions” are adoption surface area, not revenue.
- The first clean read on consumption revenue as a disclosed line — Cowork usage billing, Dynamics credits, GitHub Copilot — since that’s the entire “seat plus usage” TAM argument.
- Whether the ex-OpenAI RPO growth rate (+25%) holds, since management has made non-concentration the core of the backlog argument.
- CRM bookings — the one deteriorating trend named on the call.
Feel free to comment!
Thank you,
CoreValue Research Team


