

We upgrade our Valuation Model for TSMC, implying 18% 3 year PE IRR return.
TSMC reported a strong Q2 2026, driven by an extremely robust megatrend in AI and Agentic AI, which led the company to raise its full-year 2026 revenue growth outlook to slightly above 40% year-over-year.
To meet this surging demand, TSMC has raised its 2026 Capital Expenditure (CapEx) budget to USD 60 billion – 64 billion and announced an additional USD 100 billion investment in its Arizona facilities.
While consumer and price-sensitive markets remain challenged by macroeconomic uncertainties, AI-related demand across both cloud and edge applications continues to outpace supply significantly.
Q2 2026 Performance
TSMC concluded the second quarter at the high end of its guidance due to strong demand for leading-edge process technologies.
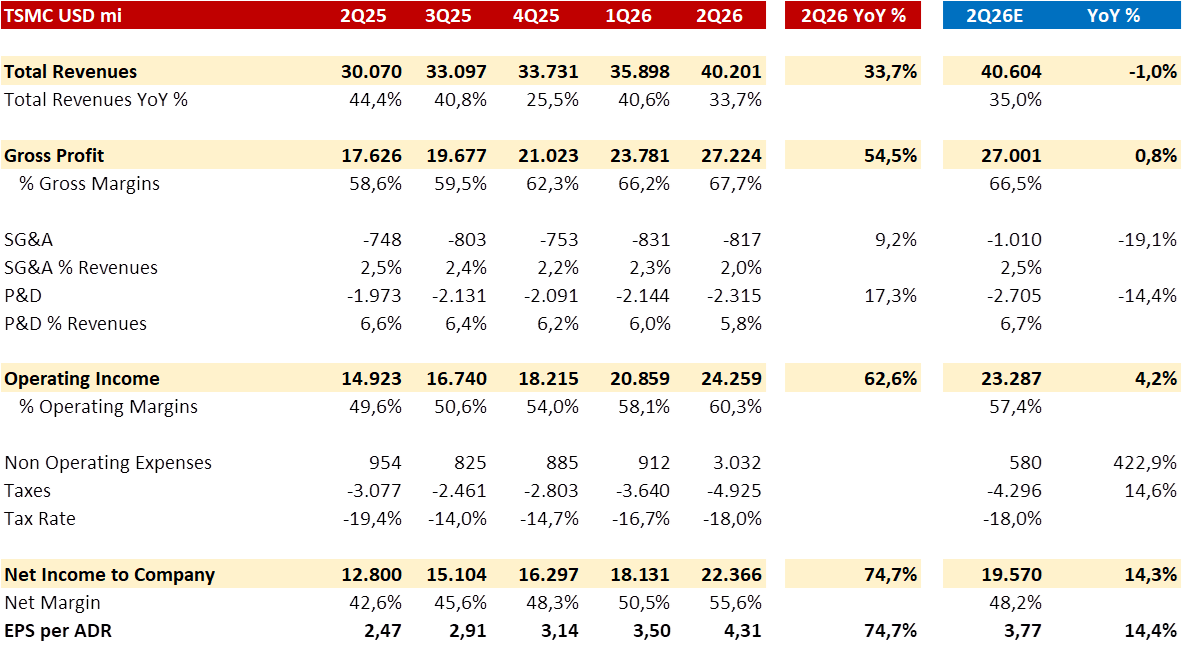
- Revenue: USD 40.2 billion, up 33,7% YoY %.

- Platform Growth (YoY): High-Performance Computing (HPC) grew 47%, Automotive grew 7%, IoT grew 34% and Smartphone revenue increased by 9%.

- Revenue by Node (Share of Total %): It’s beautiful to witness the start of a new node in TSMC Revenue, with the 2nm representing 3% of total revenue and we should see a movement similar to the growth of 3nm, but should be an even larger node!

- Gross Margin: 67.7% (an increase of 150 basis points sequentially), driven by cost improvement efforts and higher capacity utilization, though partially offset by overseas fab dilution.

- Operating Margin: As the company managed to increase price (both unit price, but also with a positive mix effect) and be disciplined with expenses, the operating margin came 300bps above the guidance!

Follow below the detailed number for the quarter and our previous expectations:
- Revenue came in 1% below ours, but with an improved Gross Margin and Operating Margins (expenses came really below ours, which indicate efficiency, discipline and scale benefits. At same time they’ve made real progress with future nodes and advanced packaging roadmap!
- NonOperating Expenses include mainly the sale of Vanguard International Semiconductor Int. (VIS).
- Without this extraordinary gain, the Net Income would be in line with ours.
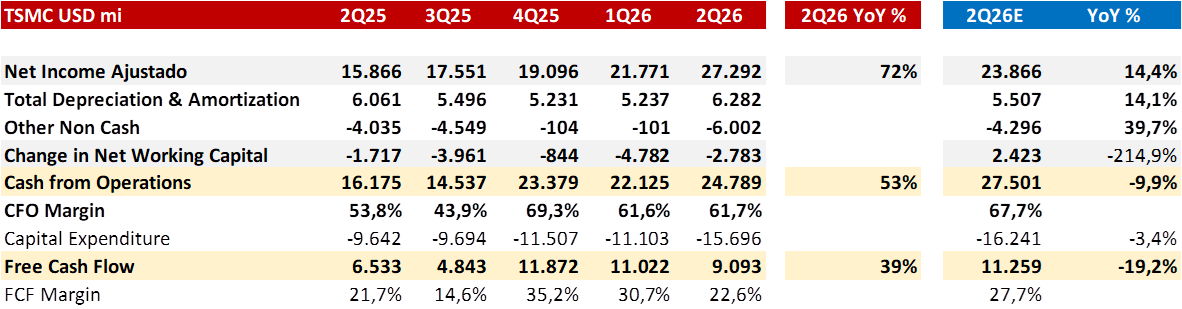
As for the Cash Flow, we had a Operating Cash Flow miss because the company is starting to accumulate inventory for the 2nm sales, that should keep ramping in 2H26.
Q3 2026 & Full-Year Guidance
- Q3 Revenue: Expected between USD 44.6 billion and USD 45.8 billion, representing a 12% sequential and 37% year-over-year increase at the midpoint.
- Q3 Gross Margin: Expected to decline to 65% – 67% due to a 3–4 percentage point dilution from the steep ramp-up of 2-nanometer technology.
- Full-Year 2026 Revenue: Upgraded to slightly above 40% YoY growth in USD terms! Se below in our conclusion why that is so important.
Capital Expenditure & Expansion Strategy
Driven by multi-year structural demand from 5G, HPC, and AI, TSMC is heavily stepping up its investments.
- 2026 CapEx: Raised to USD 60 billion – USD 64 billion (up from earlier guidance) due to increasing customer demand and inflation on tool pricing. The previous guidance was between USD 52 and 56 billion, but we at CoreValue were already expecting a 60-65 billion given all the demand we are hearing from designers and hyperscalers. That also explain why for us the results were POSITIVE!
- Budget Allocation: 70%–80% for advanced process technologies, 10% for specialty technologies, and 10%–20% for advanced packaging, testing, and mask-making.
- Global Expansion:
- United States: Announced an additional USD 100 billion investment in Arizona to build several more logic wafer and advanced packaging fabs, bringing the total Arizona investment to USD 265 billion.
- Taiwan: Building 13 leading-edge and advanced packaging fabs over the next several years.
- Japan & Germany: Increasing mature node capacity for CMOS image sensors (Japan) and automotive/industrial applications (Germany).
- Shareholder Returns: TSMC committed to steady and increasing dividends, projecting TWD 24 per share in 2026 (a 33% YoY increase).
Technology Roadmap
- A14 Technology: Representing the second generation of nanosheet transistors, A14 is on track for pre-production in 2027 and volume production in 2028. It will offer 10%–15% speed improvements (at the same power) or 25%–30% power improvements (at the same speed) compared to N2, along with a 20% chip density gain.
- A13 & A12: Scheduled for volume production in 2029. A13 will provide a 6% die area saving, while A12 introduces innovative “superpower rail” technology.
Conclusion
While the narrative in the stock price movement after market focus on the increased capex, we highlight that the growth trend is proving incredibly strong. For the company to deliver the 40% growth guidance in 2026, it have to accelerate meaningfully the revenue in the 4Q26 to 45-47% YoY % Growth.
Remember that at the beginning of the year, the expectation was for +30% YoY growth. This delta represents around USD 10 bi for the year vs expected, which should finance the increase in capex at the company long term rate or even better in our view.
Please follow below our long term expectations and valuation for the stock!
Thank you,
CoreValue Research Team


